By reading a Bitcoin chart, you can determine its current trend and see how the price has behaved historically. When trading/investing in Bitcoin or any other financial instrument, the most important thing is price action. It’s the price that determines whether you make a profit or loss, not the news or rumors.
Of course, there are many fundamental reasons why Bitcoin has become increasingly popular and therefore increased in value. However, during Bitcoins meteoric rise, it has still seen 40% drops in its value along the way.
No matter how strong the fundamentals appear to be or positive the news, there are still no limits on how big future drops can be.
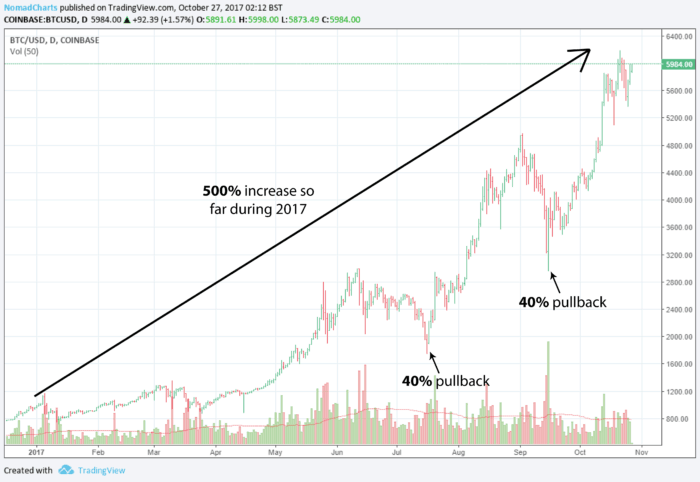
This is why charts are crucial for Bitcoin traders/investors, as they provide an objective view of what is going on.
Where to Find Bitcoin Charts
When you purchase Bitcoin, the cryptocurrency exchange or marketplace you used will likely provide free charts within their platform. However, the quality tends to be lower, and the analysis tools available are limited.
A great free option for real-time professional charts is TradingView. The platform has become increasingly popular over the last few years or so and it offers many Bitcoin charts.
In addition to Bitcoin, you can also find charts for other cryptocurrencies, stocks, commodities, and forex if that’s of interest. It provides all the tools required to analyze Bitcoin charts on multiple time frames.
Basic chart reading
Candlesticks
The candlesticks you see on a chart represent the price. Each candlestick represents the time interval you have chosen, so for a 30 minute time interval, 1 candlestick will represent 30 minutes.
A candlestick is usually green or clear when the price went up during the period (bullish), or red or filled if the price went down during the period (bearish). If the price has moved above or below the opening or closing price, then a candlestick will have an upper and/or lower wick. The illustration below indicates what each area of the candlestick represents.
Volume
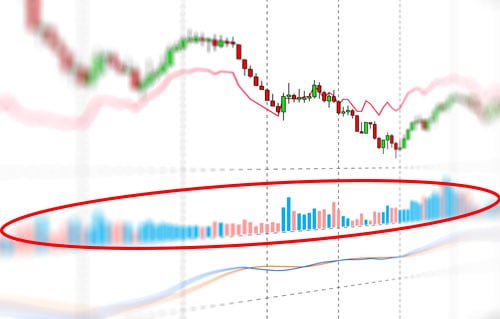
The volume is represented at the bottom of your chart by bars that are usually color-coded to define whether the majority of this volume was on the buy-side or the sell-side. You can see the volume bars highlighted by a red circle in the image below:
Other Indicators
Other indicators such as moving averages, oscillators, and various others can be overlayed on your chart using built-in functionality.
How to read a Bitcoin chart
Reading a chart can be done through the use of technical analysis; but, this does not have to be a complicated process. In fact, it’s often the more straightforward approaches that work best with charting.
When you see a chart filled with tons of different indicators, all this does is add confusion. Remember, the price action is the most important factor, and any indicators used should be to assist your analysis of it.
Technical analysis is a vast subject area with thousands of different indicators and techniques available. However, some core concepts will prove invaluable, no matter how in-depth you may choose to go.
Identifying a Trend
Trend analysis can be done with a few simple techniques and is the basis of most successful investing/trading strategies.
Price can only move in 3 different directions: upwards, downwards, and sideways.
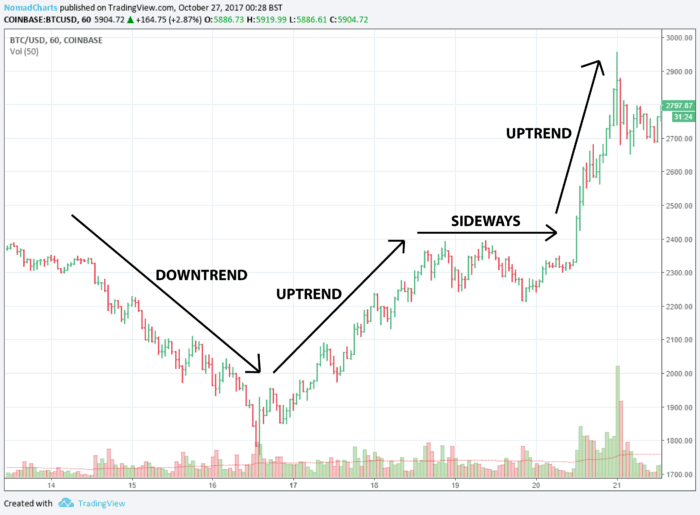
Sideways movement is also known as a consolidation or range and is a period of rest where the price has no significant increases or decreases. This is typically the most laborious price movement to profit from.
For Bitcoin to increase or decrease in value significantly, it must trend upwards or downwards. This is why the greatest opportunities for investors/traders lie in identifying and trading according to wider Bitcoin market trends.
To help you identify trends, you can use the following tools and techniques:
- Highs and Lows – By merely looking at the highs and lows on a chart, you can work out the current trend. Uptrends consist of higher highs and higher lows. Downwards trends consist of lower lows and lower highs.
- Moving Averages – A moving average sloping upwards indicates that price is in an uptrend whereas sloping downwards indicates a downtrend. They display the average price over a given period and can be set to help identify long-term, short-term, or intermediate-term trends.
- Drawing trendlines – A trendline can be drawn by connecting the lows or highs in price. You need at least 2 points of contact to validate a trendline. The angle of the trendline determines the direction of the trend.
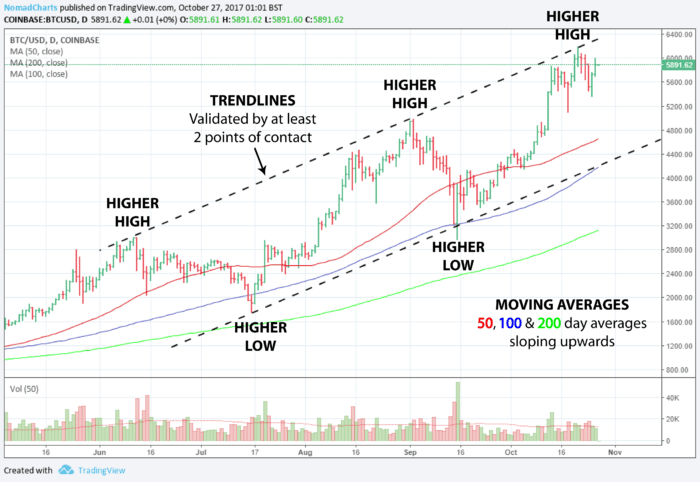
Chart Patterns
For many years successful traders and investors have used chart patterns as part of their strategy. This has been primarily for stocks, forex, and commodities; however, these same patterns are now being seen on cryptocurrency charts.
The idea is that markets are driven by human behavior – the buy and sell decisions they make. The fear and greed behind human behavior do not change; therefore, you see chart patterns that repeat over and over.
No chart pattern works 100% of the time. However, they can be used as part of an overall trading plan and help give you an edge.
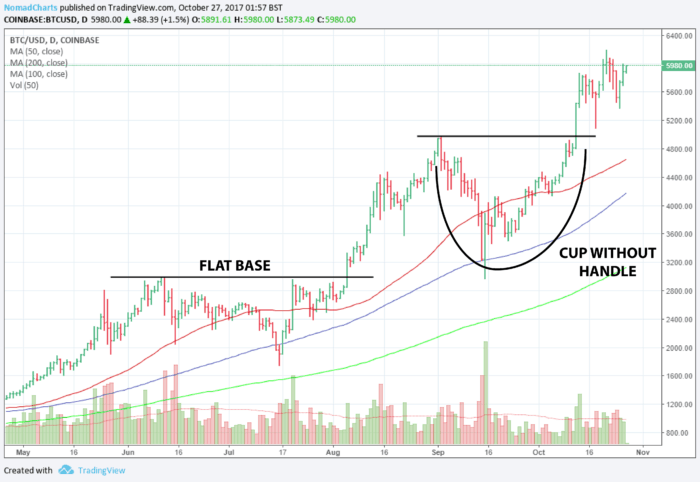
Some of the most popular chart patterns include:
- Cups with (or without) handles
- Flat bases
- Head and shoulders
- Triangles
- Flags & pennants
Volume
Volume is the best way of measuring supply and demand. You want to see heavy volume come in as Bitcoin increases in price. This indicates that there are a lot of buyers behind the move giving you more conviction.
When Bitcoin starts pulling back, you want to see it on light volume. This indicates there’s not a lot of selling pressure behind the move giving it less conviction. This means the pullback is more likely to be consolidation rather than the start of a significant downtrend.
Timeframe
The timeframe is so important when reading a chart as it needs to be relevant to your Bitcoin trading/investment plan. The timeframe is the intervals at which each point on the trading chart represents. Timeframes are useful for timing your trades properly according to your trading strategy.

If you are looking to day trade Bitcoin, then your focus should be on the lower timeframes. Common choices for day traders include 5-minute, 15-minute, 1-hour, and 4-hour charts.
If you are looking for longer-term investment opportunities, you want to be using the daily and weekly charts.
Make sure the timeframe suits your style of trading, there’s no point sweating over moves on a 5-minute chart if your average trade length is many months.
Overview of Bitcoin chart reading
The goal of reading a Bitcoin chart is not to predict future movements with 100% accuracy. It’s more about finding situations that are conducive to your trading/investing style and being aware when the warning signs are present.

Technical analysis is somewhat discretionary, and it’s not uncommon for two different chartists to come to different conclusions on the same chart. There are various forms of technical analysis, so it’s best to specialize in just a few areas rather than trying to follow too many things at once.
What are your favorite indicators? Do you believe in chart patterns? We would love to hear from you in the comments section below!
References
- What’s the Difference Between Bullish vs. Bearish
- Most common chart patterns by IBD
- Candlestick charting 101


![A Beginner’s Guide to Monero – What Is XMR? [Updated 2023]](https://cd.blokt.com/wp-content/uploads/2019/04/Beginners-guide-to-Monero-2-218x150.png)

![Best 5 Bitcoin Sports Betting Sites [2023] (Analyzed & Approved) Best Bitcoin Betting Sites](https://cd.blokt.com/wp-content/uploads/2020/05/best-bitcoin-betting-sites-218x150.png)

