In this article, I would like to do something unconventional. Rather than predicting the current market from the perspective of a day trader (which by the way is “very choppy“ these days), I’d like to focus on long-term trading, and in particular, on holding an investment for months or years. This is often said to be the best approach, but is it?
Not really, and we’ll explore why not.
Here are some questions that long-term holders struggle with: Is now the best time to buy or sell? Is the price going to go up or down in the long run? How do I make sure that when I sell or buy, it is the best price I can get?
I could continue with these tricky questions that investors are faced with all day. Let’s explore the answers to some of these questions.
Elliott Wave Principles can answer them, and people usually say:
“Oh boy, here we go again, another self-fulfilling prophesy.”
Is it just that, prophesy, voodoo? Or whatever you want to call it? I say no. One of the reasons people do not believe in these theories is because they just want to get rich overnight. They think that the price will go up forever, they don’t have time to wait, and that is why the majority of them will lose their investment even if they keep it for the long-term. How can that be?
Statistics from stock and crypto market shows us that the majority of long-term holders will fail to identify the best sell price and will wait until they have lost about 75% of their initial investment to sell. That is sad if you ask me.
Let’s take a look at Elliott Wave Theory and how we can use it to identify the best time possible to buy or sell.
The Elliot Wave Theory:
The basic model of the Elliott wave principle is how price moves not in a straight line but in a series of rises and retracements. A good analogy is the tide coming in; the water rises in a series of advancing waves followed by receding ones.
It is very important that you understand the Elliott wave concept and how to identify it on a live chart which we will get into shortly.
Elliott waves are composed of two main phases: the motive phase and the corrective phase. The motive phase is formed with three advancing waves, 1, 3, and 5 and counter-trend waves 2 and 4. The corrective phase is composed of two receding waves, A and C, and a counter-trend wave between, B.
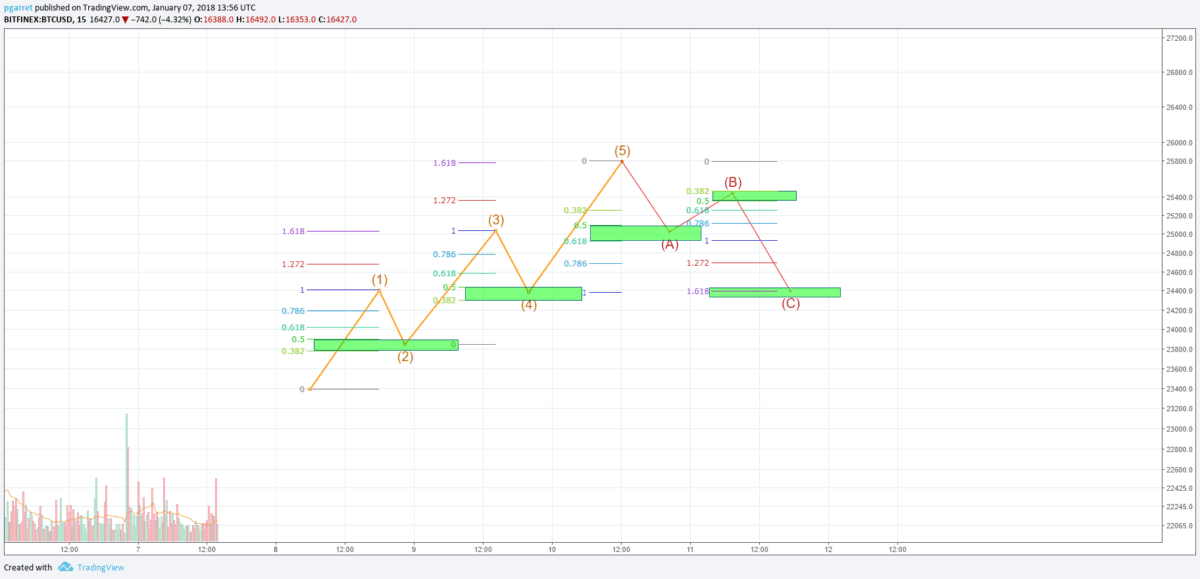
Let’s take a look at the chart below as an example:

On this chart, we have the five motive waves with the Fib ratio for retracement and extension, which should help you identify the sell and buy zones easily.
The rules for the motive phase are:
- Motive waves can head up or down.
- Wave 2 never moves beyond the start of wave 1.
- Wave 3 is never the shortest wave.
- Wave 4 never overlaps wave one unless it is a triangle formation, which usually happens in crypto and not in the stock market.
- Waves 2 and 4 tend to alternate in form. If wave 2 is a zigzag wave, 4 will be a flat wave.
- One of the waves 1, 3 or 5 will often (but not always) be much longer (extended) than the other two. We will see an example where the third wave is an extended wave with a 3-3-5 subwave formation.
The rules for the corrective phase are:
- Corrective waves can head up or down.
- Wave B terminates near the start of wave A (in crypto sometimes goes above wave A)
- Wave C terminates near the end of wave A, often slightly beyond the end (in crypto it can go much lower with as much as 100%)
Okay, so enough with the theory, just remember that it is essential to follow the rules when you are counting the waves on a real chart because if you get confusing results, it’s most probably because you missed out some of the rules.
From my experience, when you start counting the waves on a real chart, you will get confused and most certainly get it wrong the first time you try.
Here is a method I use, which helps me overcome the counting issue.
If you use the same chart tool I’m using (tradingview.com), then you go to the top bar where you can change the candlestick display and choose Heikin Ashi instead. I will show you a chart below with an example, but what this does for you is create a combo candlestick of red or green candles that corresponds with the trend, which in our case are the waves, and you can count them in that way. Heikin-Ashi represents the average pace of prices, so is going to hide bearish or bullish candle patterns but is very good at identifying trending periods, which is what waves are all about.
Note: The Heikin Ashi technique can be used by itself to do trades but is not subject of this article.
Tips: When counting the waves, please use a higher time frame; otherwise, you will never finish counting the waves and most probably miscount them all together. Depending on how much historical data you have for example in crypto I use 4-6h time frame for coins with less than a years worth of data, and one day for coins with at least one years worth of historical data.
Let’s take a look at a real example for POWR/BTC:

You can see from the chart that on the Heikin Ashi candlestick pattern it is easier to count the waves. Here we have the past cycle of POWR with all eight waves, 5 motive and 3 corrective. In crypto, the corrective waves will usually claim more than 60% of the all-time high price. I would argue that the norm is 75 – 80% and in extreme cases correlated with bad news, 100 -120% is possible. An example of such a situation was when Bitshares lost 120% of the market entrance price.
The corrective phase of the last cycle is not complete for POWR, so I’m making a little bit of a prediction here. In crypto, the B wave sometimes goes above the fifth wave all-time high price. As with any projection, I may be wrong, but I think that POWR at $1.81 current price is undervalued, so the bounce of wave B could extend beyond the top of the fifth wave. Only time will tell if I was right or wrong, and often, the price action of Bitcoin can have an influence.

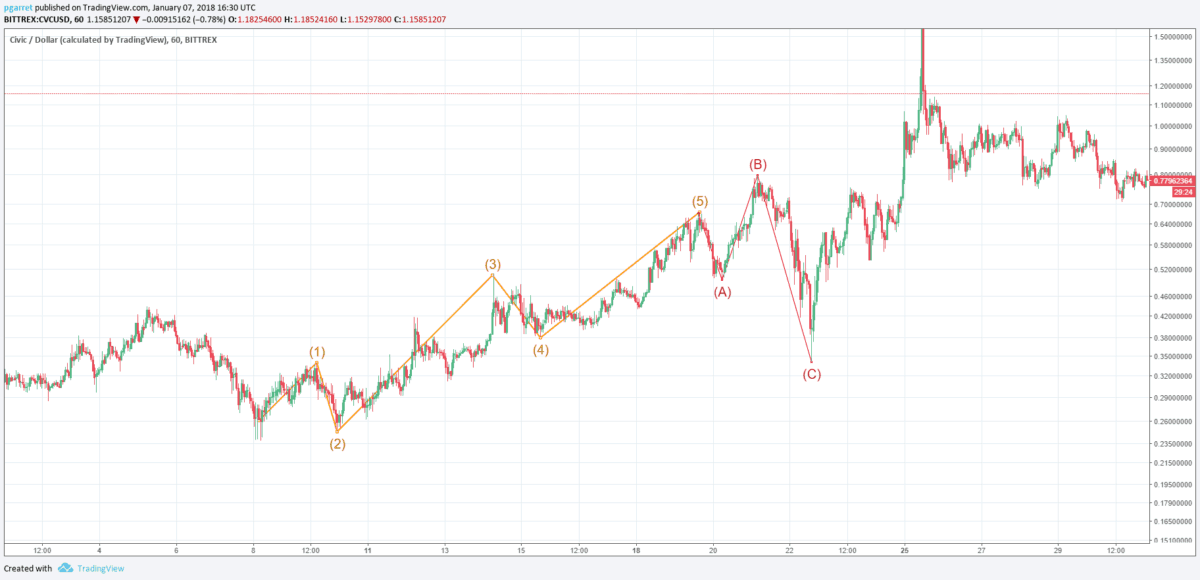
On this chart, we have a past Elliott waves cycle in CVC where the B wave surpassed beyond the fifth wave. You need to be mindful that crypto is a very volatile market, and sometimes the rules are not broken but extended.

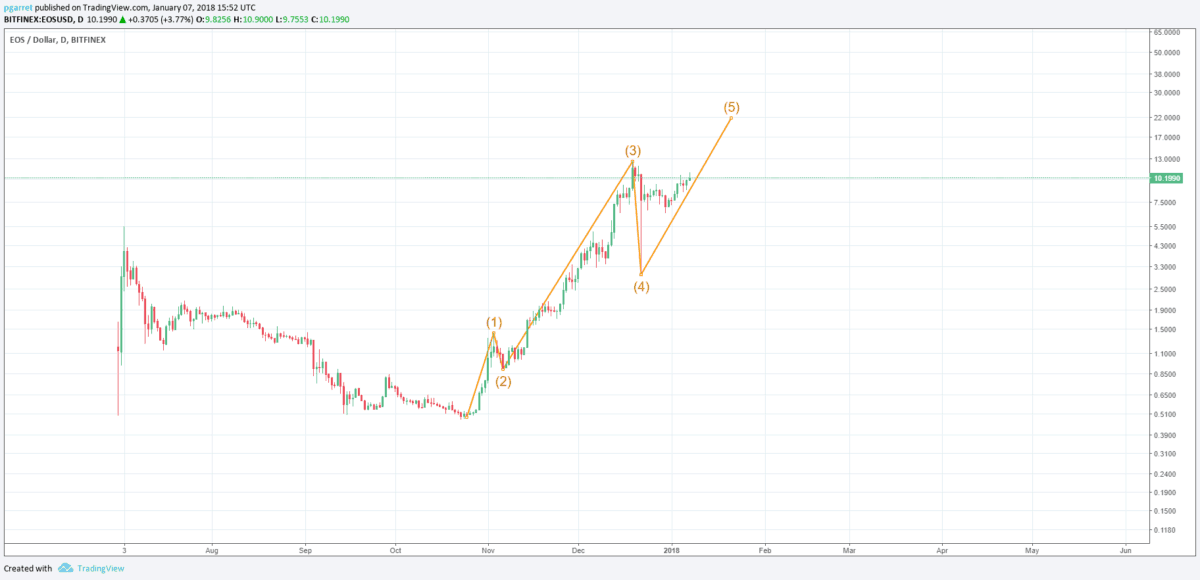
This is an example chart for EOS Elliott wave cycle with an extended third wave. The fifth wave is a typical wave, and the price will most likely top at around $22.
Lessons learned:
Do your research before deciding to buy or sell during a bullish or bearish market. If you’re a long-term holder, the Elliott Waves Principle is your best friend when spotting the best point to buy and to sell. Do not blindly follow only the news and hype when buying or selling; the news can be sensationalized to fool people into buying the tops and selling the bottoms.
What are the best buy points?
The best time to buy is at the start of a trend (the first wave). That’s the best risk to reward ratio you can get. Along the 5 waves uptrend, you can buy at the end of the second wave or fourth wave. Please try to not buy near the top of the third or fifth wave. If you do, please do not panic-sell on the correction. First, count the waves and see how much you can recover from your mistake.
What is the best selling point?
As a long-term trader you should only sell on a fifth wave, please do your research and never sell on corrective waves, especially on the C wave, as statistics show us that people often people do.
| DISCLAIMER: Investing or trading in digital assets, such as those featured here, is extremely speculative and carries substantial risk. This analysis should not be considered investment advice, use it for informational purposes only. Historical performance of the assets discussed is not indicative of future performance. Statements, analysis, and information on blokt and associated or linked sites do not necessarily match the opinion of blokt. This analysis should not be interpreted as advice to buy, sell or hold and should not be taken as an endorsement or recommendation of a particular asset. |


