Bitcoin [BTC] Price Analysis:

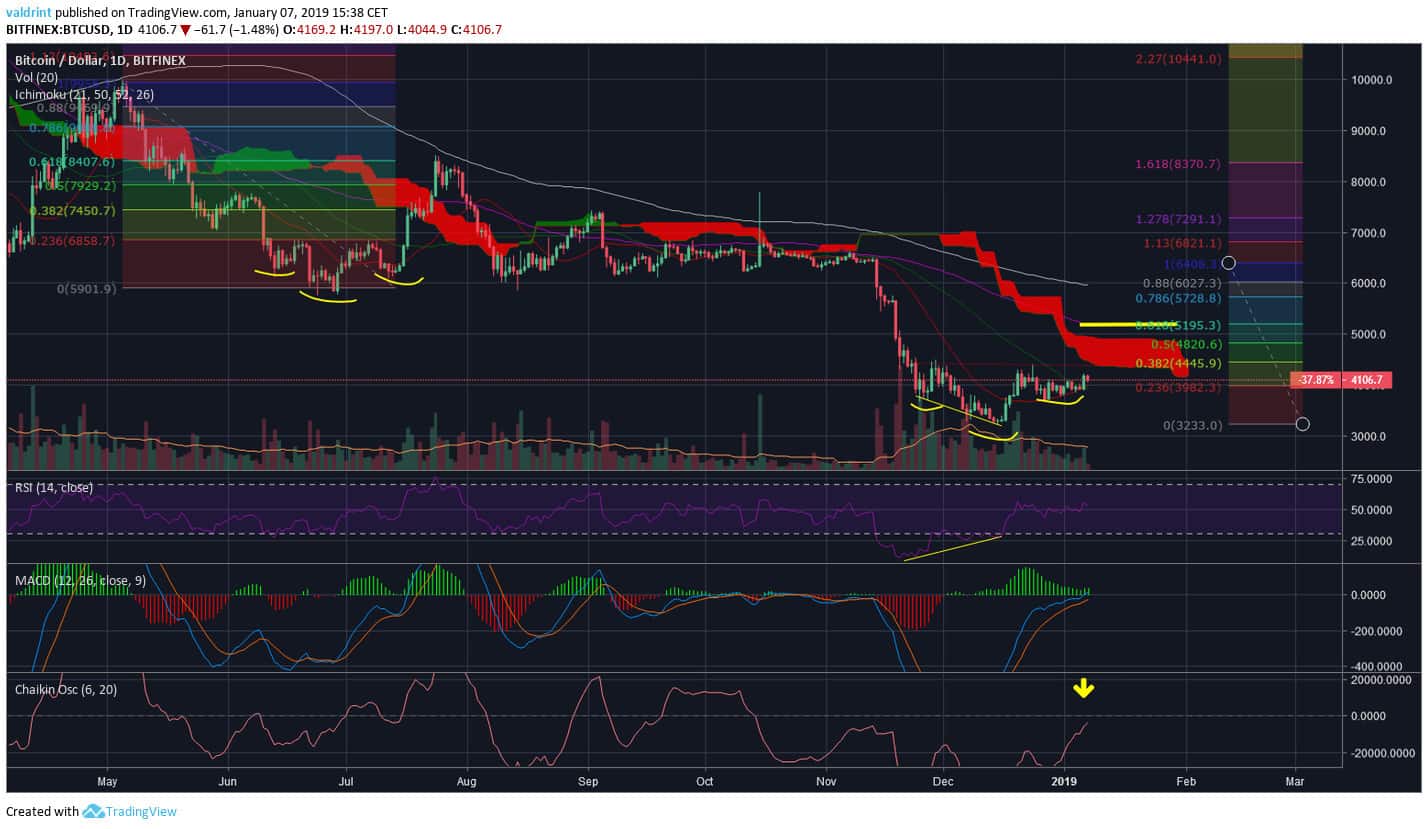
A look at the Daily chart for Bitcoin shows that price is currently trading at the $4100 level.
Price is trying to make a reverse head and shoulders pattern with a neckline at $4440, coinciding with the 0.382 fib level of the entire drop from $6400.
Furthermore, this pattern has similarities with the previous reverse head and shoulders that occurred in June-August 2018.
If price repeats the same movement, we should have a price increase of up to $5200 (the 0.618 fib level) before a reversal occurs.
A look at the indicators shows that there was a significant bullish divergence in the RSI before the original move up to $4400, before the formation of the right shoulder.
Furthermore, the Chaikin Oscillator is trying to move past 0, a positive sign.
The MACD has just turned positive, but it is losing steam. In regards to the moving averages, the price has moved past the 7 and 21 period MAs, which have made a bullish cross.
Price is facing resistance from the Ichimoku cloud and the 50/200 period MAs.
Even though my outlook for the market is still bearish overall, I believe that this recent upward move has not yet ended, and we should test the $4800-5200 area soon.
Ethereum [ETH] Price Analysis:

A look at the Daily chart for Ethereum shows that price is trading at the $150 level.
We can see that there was a significant bullish divergence in the RSI and the MACD during the lows of December, after which a reversal of almost 100% from 80 to 160 occurred.
Price has started to develop bearish divergence in both the RSI and the MACD; however, the amount is quite small compared to the one that preceded the increase in price.
As for the moving averages, the price has moved past the 7 and 21 period MAs, which in turn have made a bullish cross.
Furthermore, the price is at a critical point trying to break out of the cloud and facing resistance from the 50-period MA.
The next area of resistance is in the $170-190 area and the one after at the $250 area, coinciding with the 200-period MA.
The closest support area is at the $120 level, followed by the recent bottom at $80.
XRP Price Analysis:

A look at the Daily chart shows that XRP is moving within a symmetrical triangle and trading at the $0.37 level.
The RSI is close to 50, indicating neither overbought nor oversold conditions. The Chaikin Oscillator is close to moving past 0, a positive sign.
The MACD is stuck between doing a bullish/bearish cross, with almost 0 volume.
As for the moving averages, the 7 and 21 MAs are undecided on whether to make or reject a bullish cross and price is facing resistance from the Ichimoku Cloud and the 200 period MA.
While XRP had an increase of close to 200% in October, it seems that the market is tepid at this point, and I would expect it to move within the confines of the symmetrical triangle in January at least.
Stellar Lumens [XLM] Price Analysis:

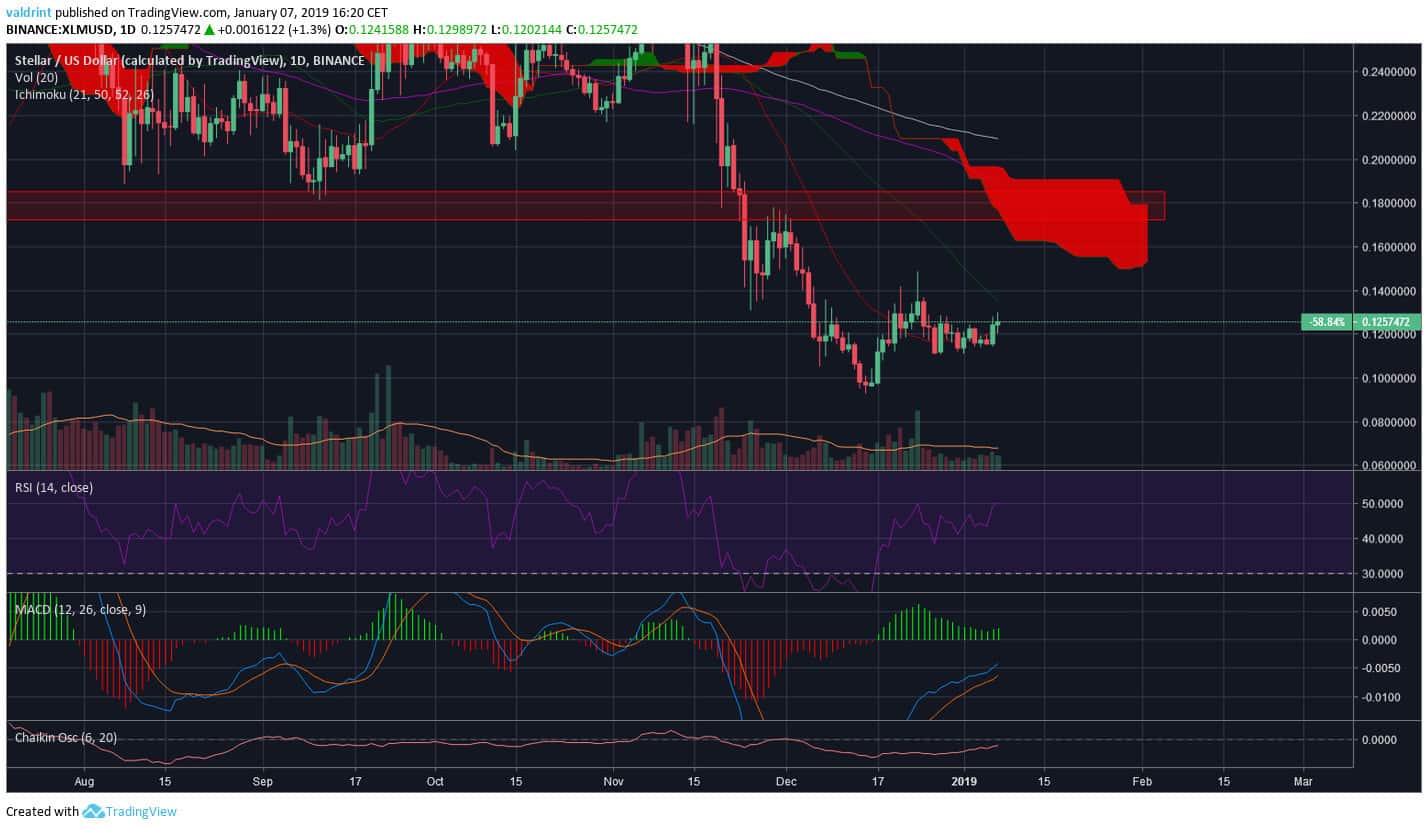
The RSI is at 50, indicating neither overbought nor oversold conditions in the market.
The MACD is slowly moving up but is not positive yet. As for the moving averages, the price has moved past the 7-period moving average, which is trying to make a bullish cross.
However, the price is facing resistance from the 21,50 and 200 period moving averages and the Ichimoku cloud.
The next significant area of resistance is at $0.18 which coincides with the edge of the Ichimoku cloud.
The market has not shown its hand yet, and it is not clear whether the bulls or bears are in power. However, price does not face any significant resistance until the $0.18 level.
Litecoin [LTC] Price Analysis:

A look at the Daily Chart for Litecoin shows that price is currently trading at the $38 level.
Price seems to be moving in an ascending wedge (bearish pattern) and trying to break out of the Ichimoku cloud.
The next significant area of resistance is at the $50 level, coinciding with the end of the wedge pattern in late January.
The beginning of the wedge coincided with a long period of significant bullish divergence in the RSI, preceding the whole upward move.
Right now the MACD is developing bearish divergence, but at a small amount relative to the preceding bullish divergence in the RSI.
As for the moving averages, the price has moved past the 7 and 21 period MAs which are making a bullish cross.
However, the price is facing resistance from the 50-period MA and the edge of the cloud.
In my opinion, price continues to move within the confines of the ascending wedge, before ultimately breaking down and testing the $30 level of support again.
Cardano [ADA] Price Analysis:

The upward move was preceded by significant bullish divergence in the RSI. Currently, the RSI is developing bearish divergence, but it is a small amount relative to the preceding bullish divergence.
Furthermore, the MACD seems to be losing power, making lower highs as we increase in price.
As for the moving averages, price has moved past the 7 and 21 period MAs which have made a bullish cross.
However, the price is facing resistance from the from the 50-200 period MAs and the Ichimoku cloud.
If it breaks, the next area of resistance will be at the $65 level, formed by support. The levels of support are $35 and $30.
EOS Price Analysis:

A look at the Weekly chart for EOS shows that price is currently trading at the $2.8 level, within an area of small resistance.
The next area of resistance is at the $4.2-4.4 level, coinciding with the 7-period moving average. The RSI is below 40, almost indicating oversold conditions.
The MACD has almost made a bullish cross, and the Chaikin Oscillator is about to move past 0, both positive signs.
As for the moving averages, the price is facing resistance from the 7 and 21 period moving averages and the Ichimoku Cloud.
IOTA Price Analysis:

A look at the Daily chart for IOTA shows that price is currently trading at the $0.37 level.
The RSI is developing bearish divergence, but not at a very significant amount.
The MACD is close to making a bearish cross, and has completely lost its power.
Price has moved past the 7 and 21 moving averages, which have made a bullish cross. Furthermore, the price has broken out of the Ichimoku Cloud.
However, the price is facing resistance from both the 50 and 200 period MAs.The next area of significant resistance is at the $0.45-0.48 level, while the support area is at $0.30
Tron [TRX] Price Analysis:

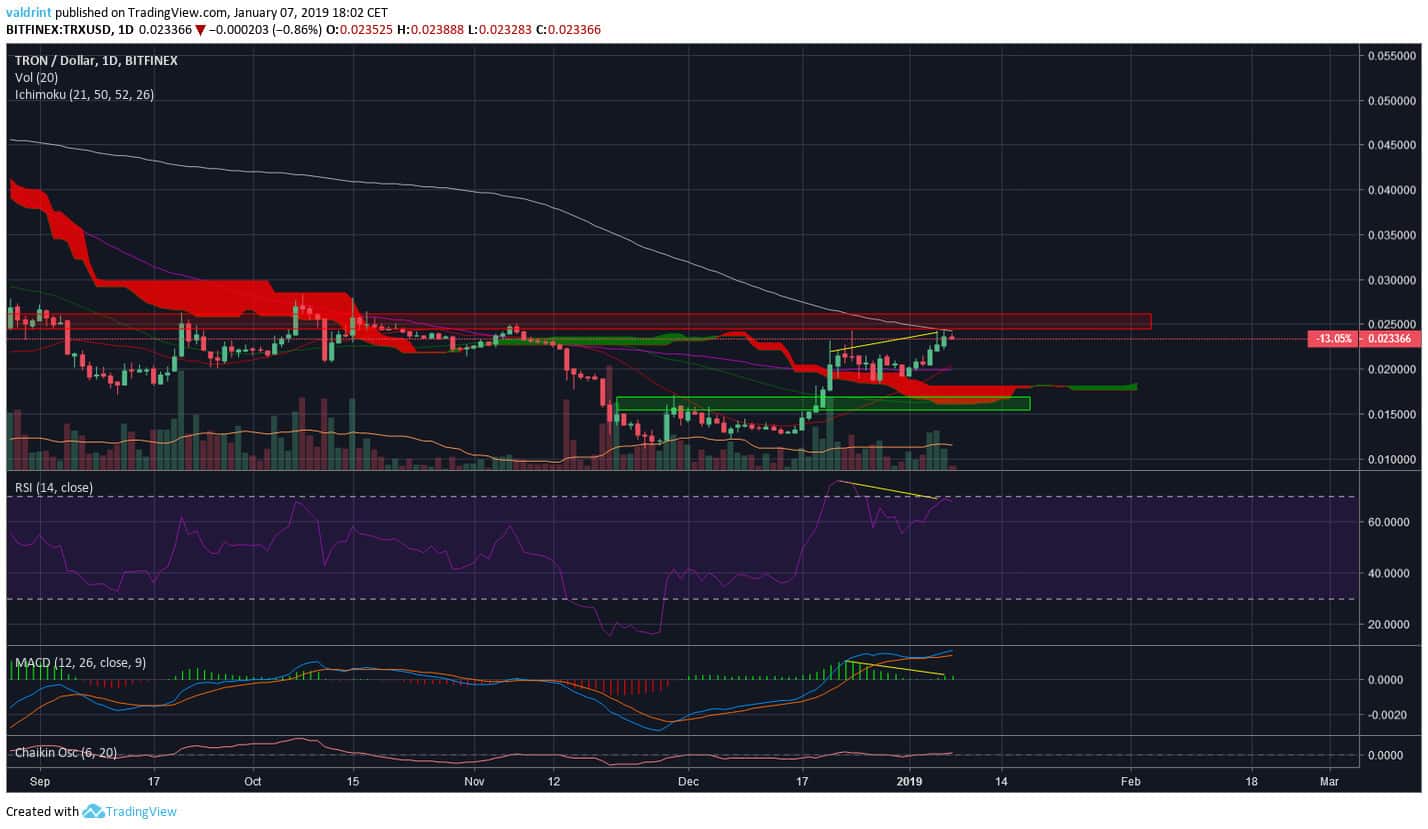
A look at the Daily chart for Tron shows that price is currently trading at $0.023.
Price is currently in the area of resistance at $0.025 formed by the previous highs. The area coincides with the 200-period Moving average.
Furthermore, the price has developed significant bearish divergence in the RSI and the MACD is losing power.
Price has moved past the 7, 21 and 50 period moving averages which have made a bullish cross. Also, the price has broken past the Ichimoku Cloud.
If it breaks the current resistance, the next area of resistance is at the $0.32-0.33 level formed by previous lows, while the closest support area is at the $0.16 level.
Dogecoin [DOGE] Price Analysis:

A look at the Weekly chart for Dogecoin shows that price is currently trading at $0.0023, within the support area formed by previous lows.
This support area has held for more than a year.
If it breaks, the next support area is found at $0.001.
The RSI is at 40, indicating neither overbought nor oversold conditions. The MACD is slowly rising, trying to make a bullish cross.
The first area of resistance is at the $0.0034-0.0035 level.


