XRP Price Prediction and Analysis:
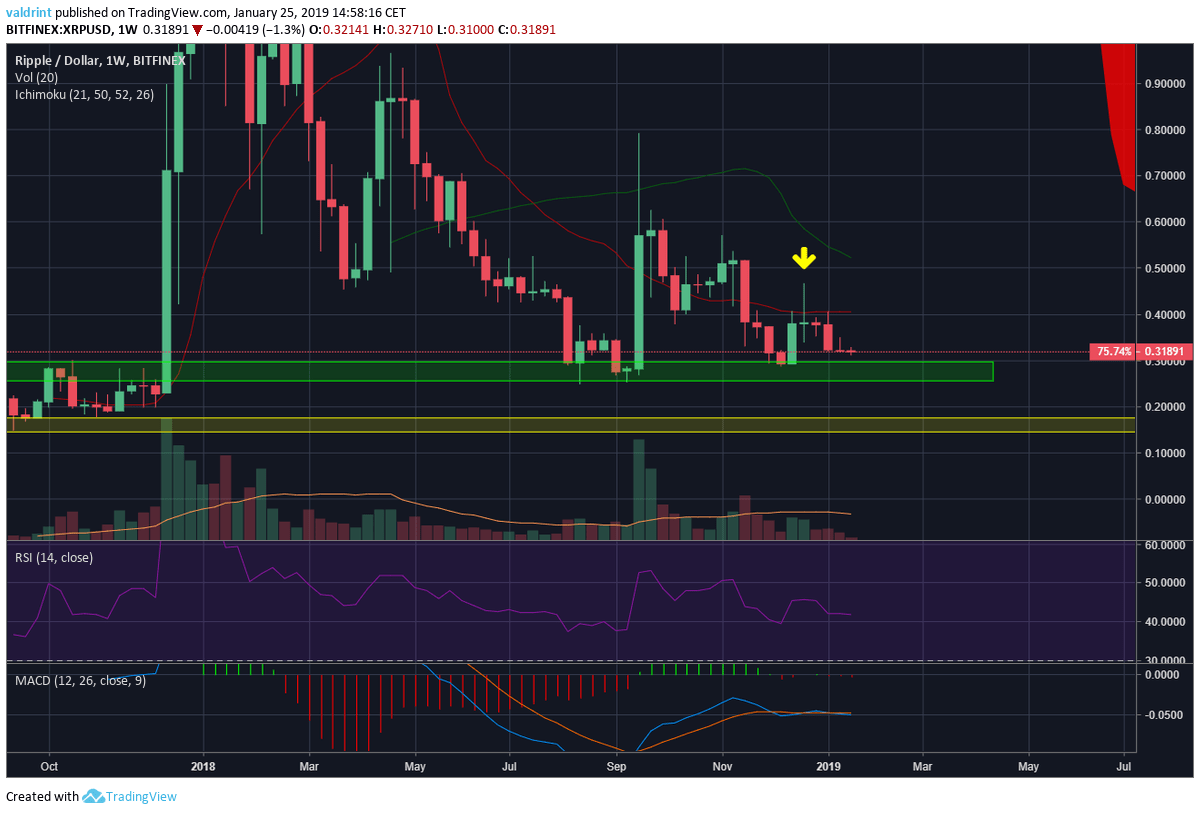
A look at the Weekly chart for XRP shows that price is very close to the major support area at $0.30.
Price is trading below the 7 and 21 period moving averages.
Price tried to break from the resistance offered by the 7-period MA during the last week of 2019 but was immediately pushed back resulting in a Doji candle (yellow arrow).
There has been virtually no movement in the MACD for 8 weeks.
Currently the price is trading at $0.31.
If the $0.3 support area fails to support price, the next one will be found at $0.16-$0.18.
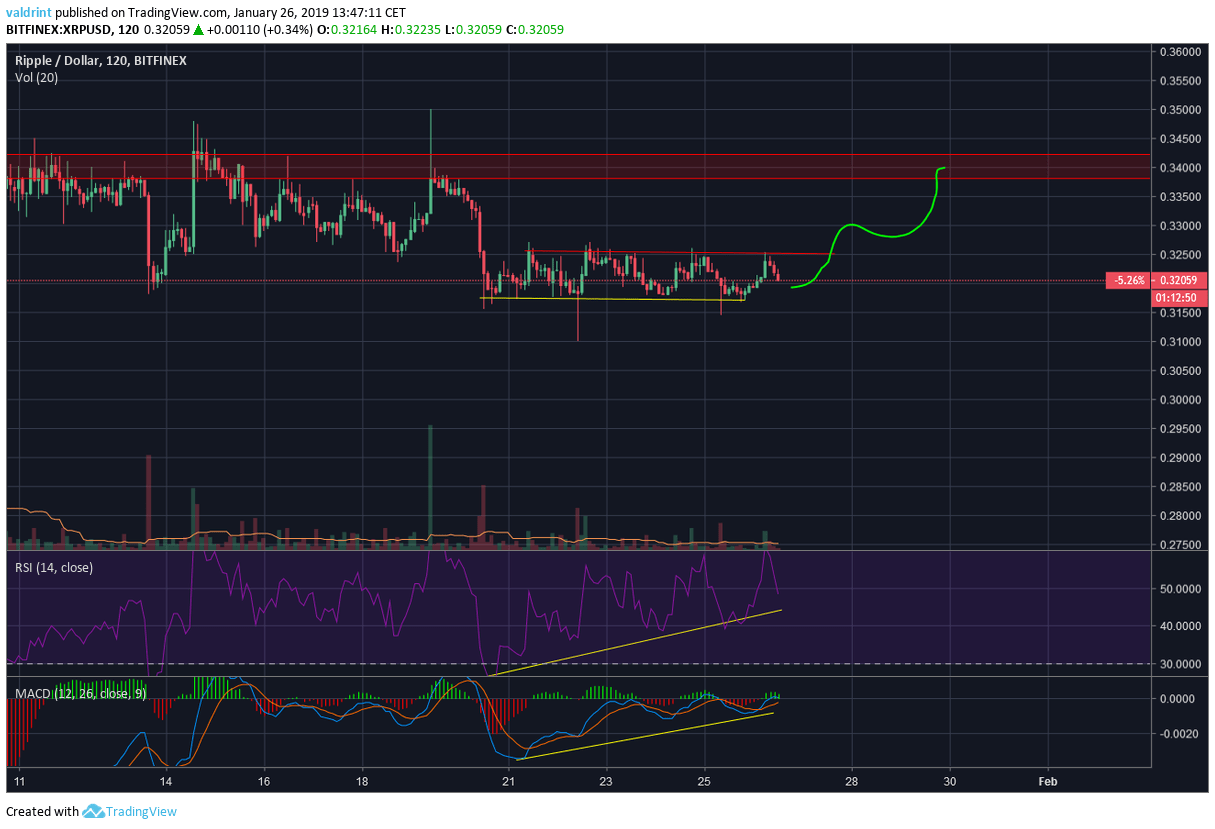
A look at the 2-hour chart for XRP gives more information about where price might be headed.
We can see that price tried to break the $0.325 level multiple times but got pushed back every time.
However, the price is creating significant bullish divergence in both the RSI and the MACD.
Price Prediction: I believe that during next week XRP will break the $0.325 resistance and head for $0.34
Stellar (XLM) Price Prediction and Analysis:
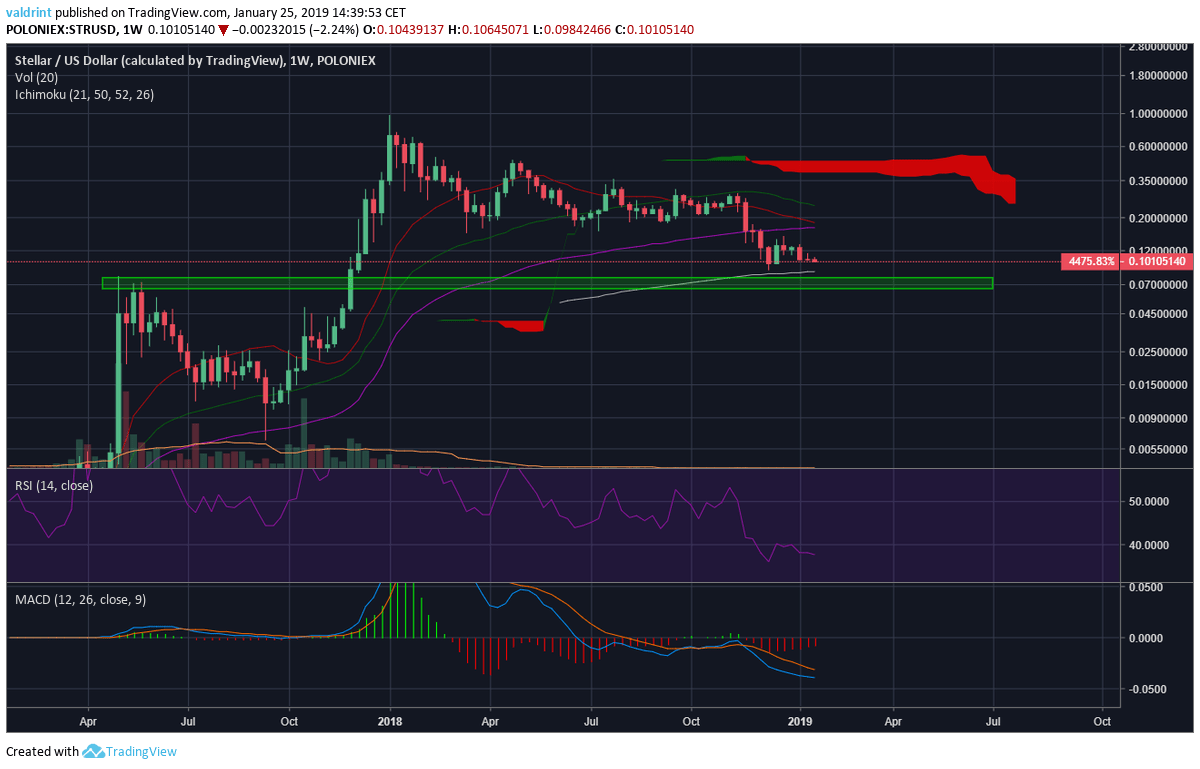
A look at the Weekly chart for Stellar in logarithmic form shows that price is currently trading at $0.1, finding support at the 200-period moving average.
Price is very close to the $0.7 support area formed by the highs of 2017.
Price is currently trading below the 7, 21 and 50-period moving averages and the Ichimoku cloud.
The MACD is falling but losing its power, and seems likely to make a bullish cross.
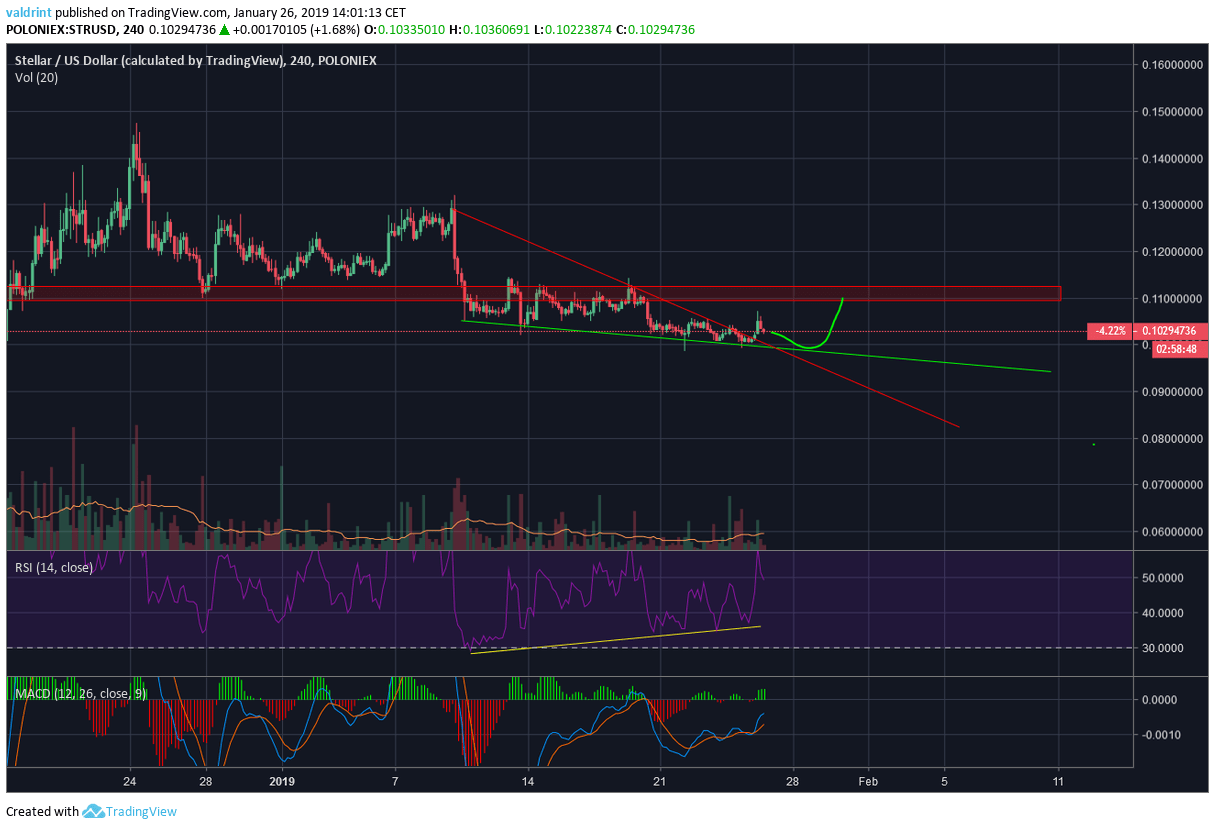
A look at the 4-hour chart for Stellar gives more information about where price might be heading.
We can see that after a long period of developing bullish divergence, price broke out of a descending wedge and a small retracement ensued.
Price Prediction: I believe that during the next week price will head for the resistance at $0.11, after possibly validating the resistance line.
Tron (TRX) Price Prediction and Analysis:
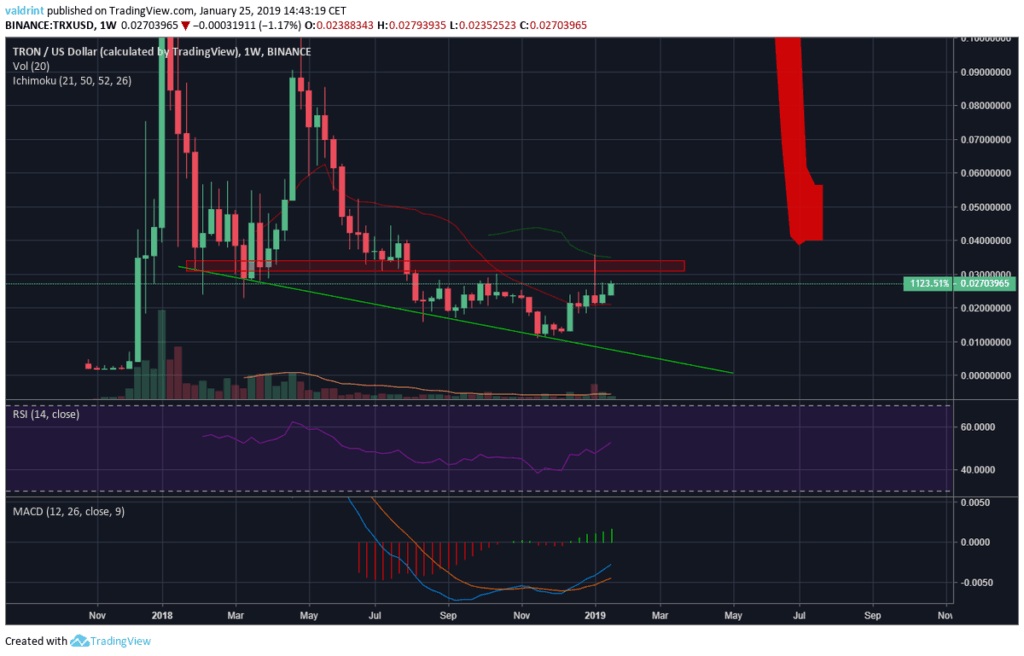
A look at the Weekly chart for TRX shows that price has moved past the 7-period moving average and is now headed for the $0.033 resistance area which coincides with the 21-period MA.
Furthermore, the MACD is moving upward with strength and has almost turned positive.
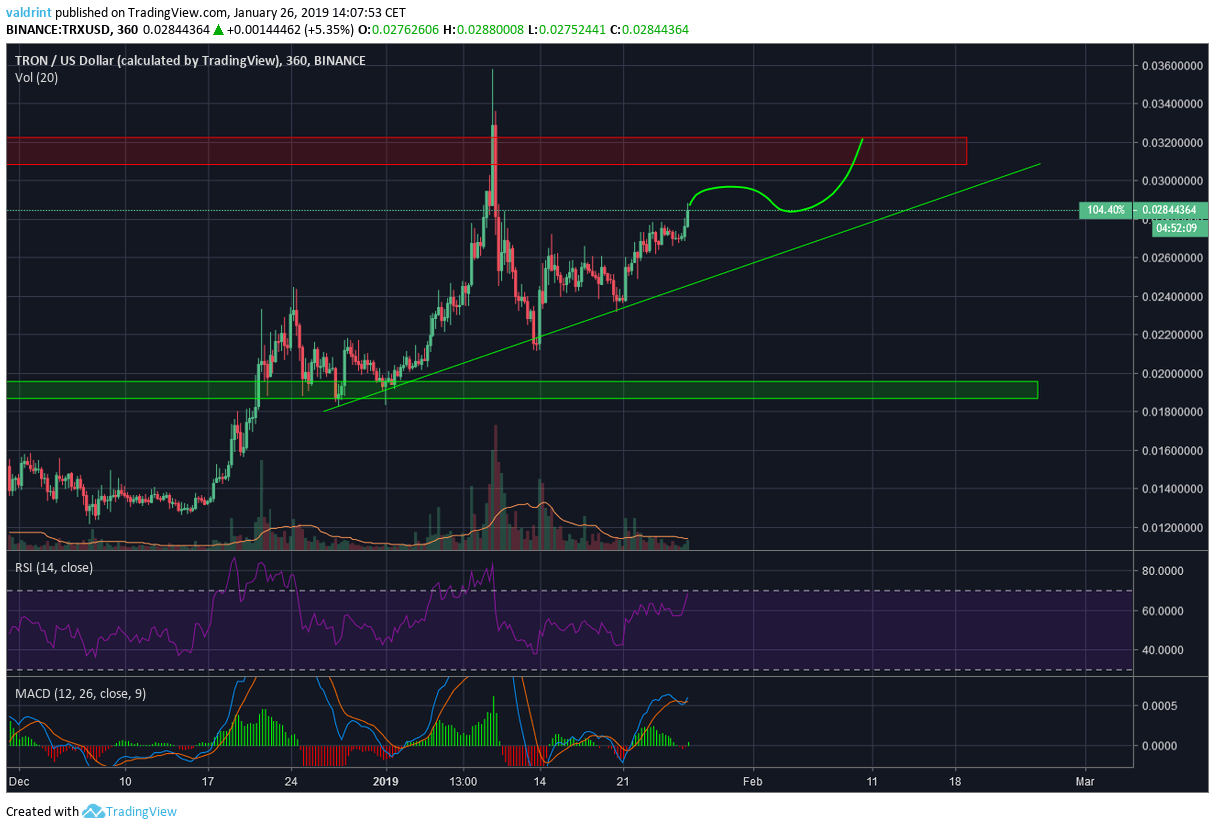
A look at the 6-hour chart for TRX shows that price is moving up while following a steady support line.
There is no bearish divergence in the RSI nor MACD, and both are moving up.
Price Prediction: Given this information, I believe during the next week price will head to the $0.32 resistance after possible retracing to the support line.
Cardano (ADA) Price Prediction and Analysis:
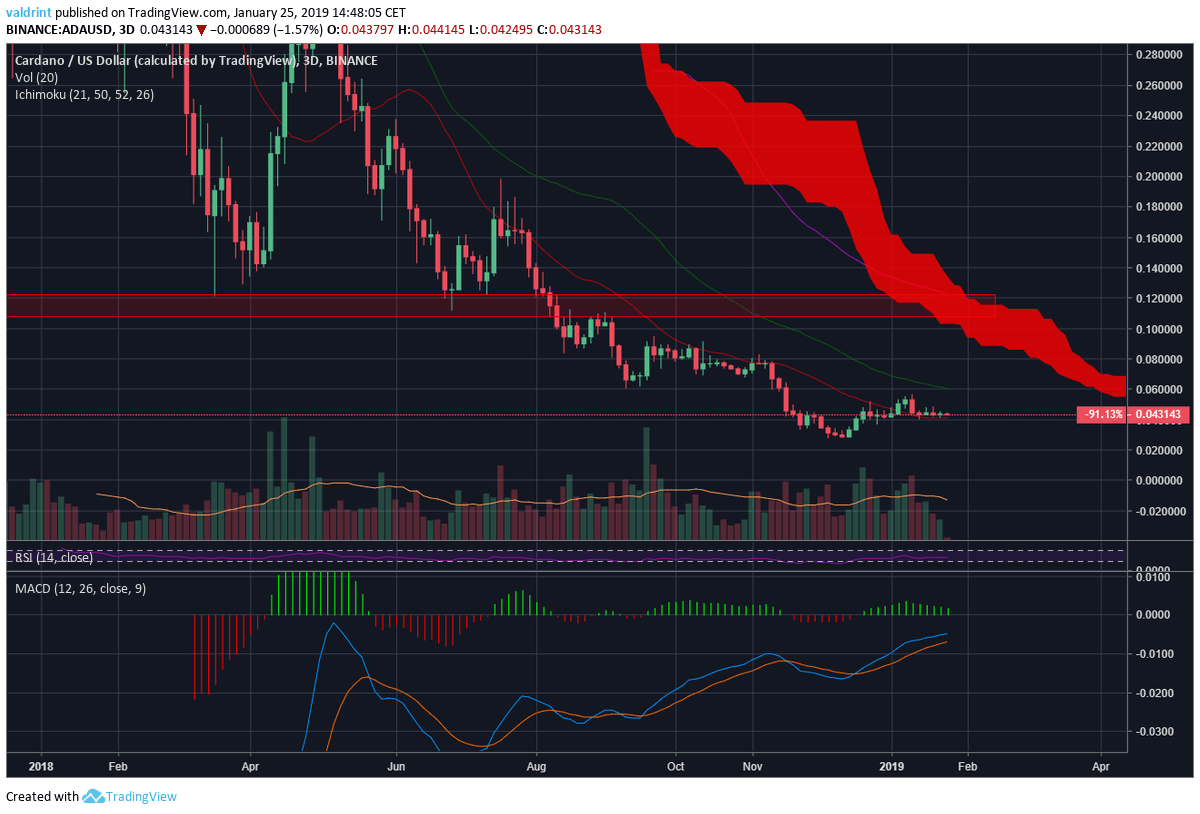
A look at the 3-day chart for ADA shows that price has just moved past the 7-period MA and is trading at $0.043.
Price is still below the 21,50,200 period MA and the Ichimoku Cloud.
The MACD is going up but is not yet positive, and it seems to be losing power.
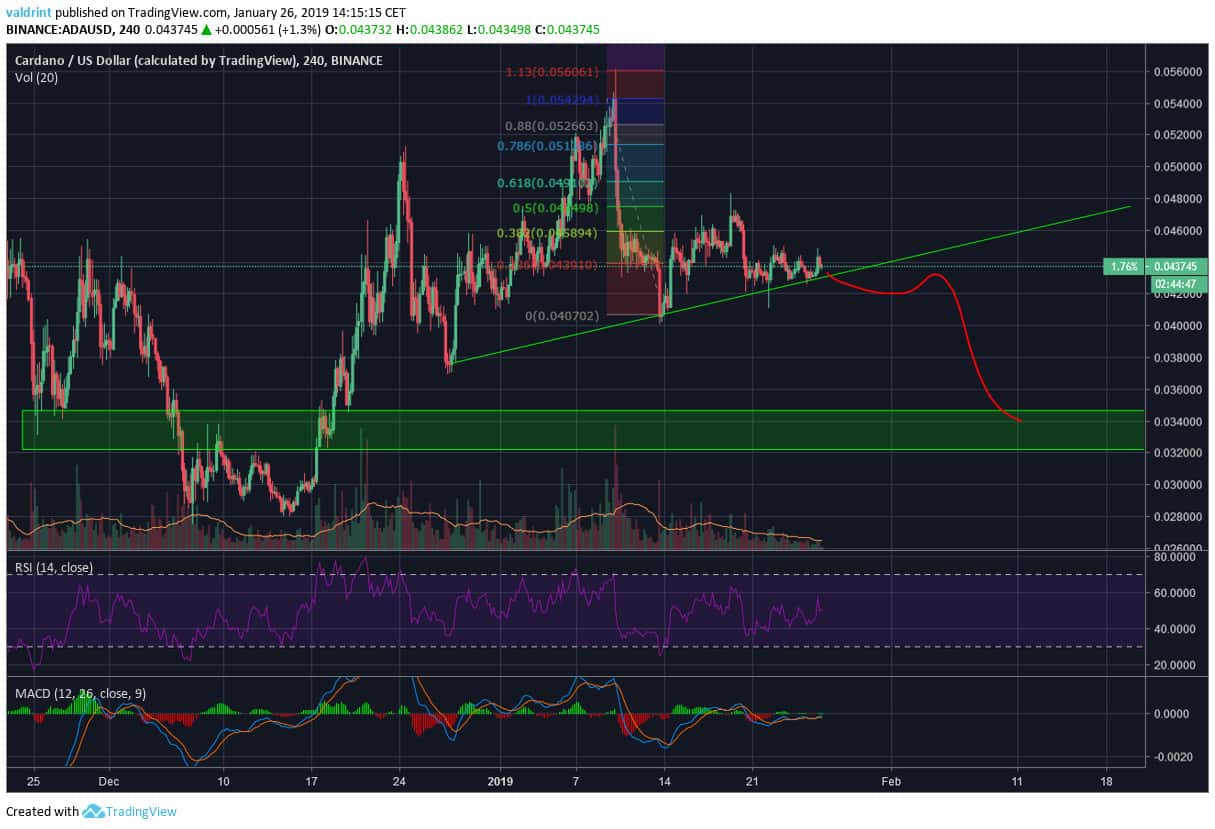
A look at the 4-hour chart for ADA shows that after the drop from $0.54, price failed to break the 0.5 fib level and fell back to the support line.
There is no bullish or bearish divergence developing.
Price Prediction: I believe that during the next week price will break down from the support line and head for the support area at $0.32-$0.34
IOTA Price Prediction and Analysis:
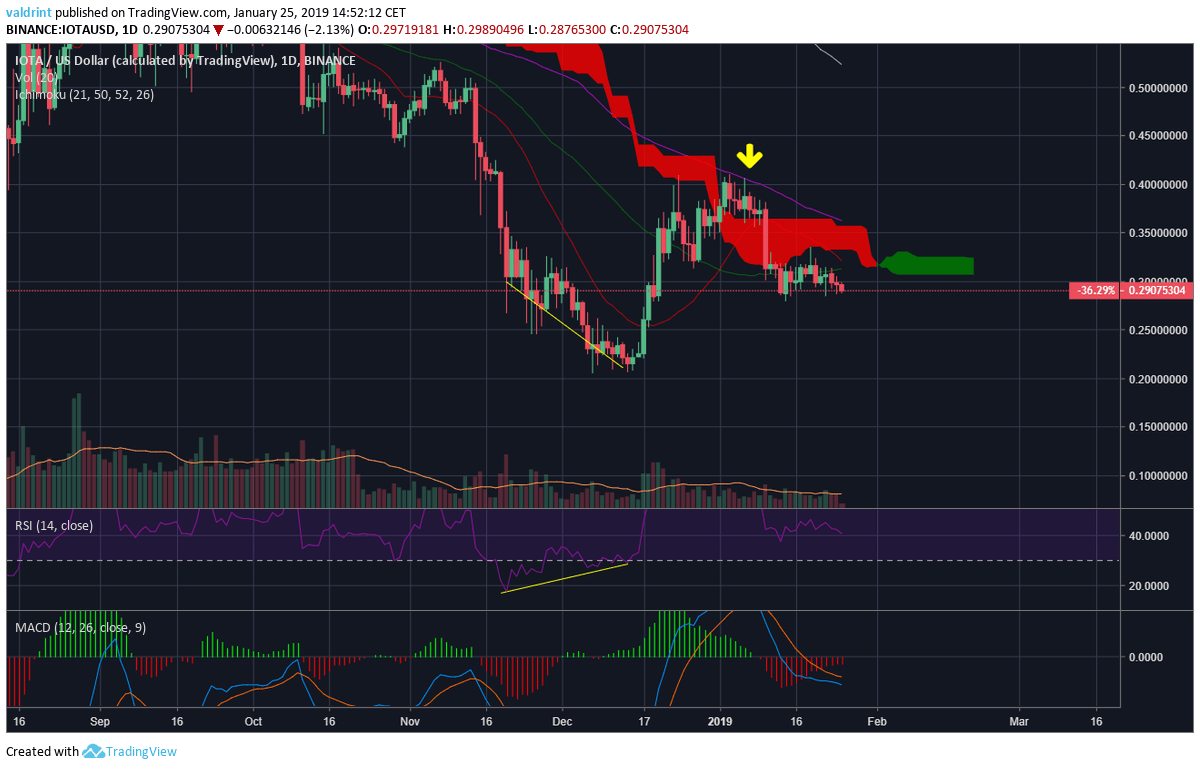
A look at the daily chart for IOTA shows that after a period of sustained bullish divergence, the price made an attempt to break out of the resistance provided by the Ichimoku Cloud and the 50-period MA at $0.4 but was promptly turned back.
The MACD is flattening and is almost ready to make a bullish cross.
The projected cloud in February is positive. Price is currently trading at $0.29
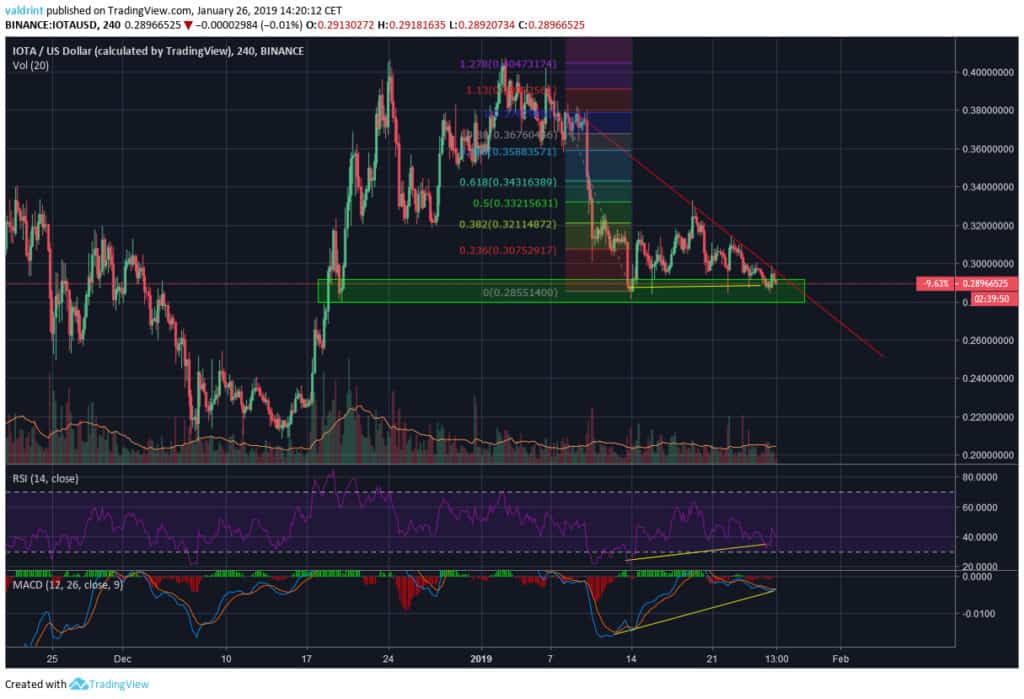
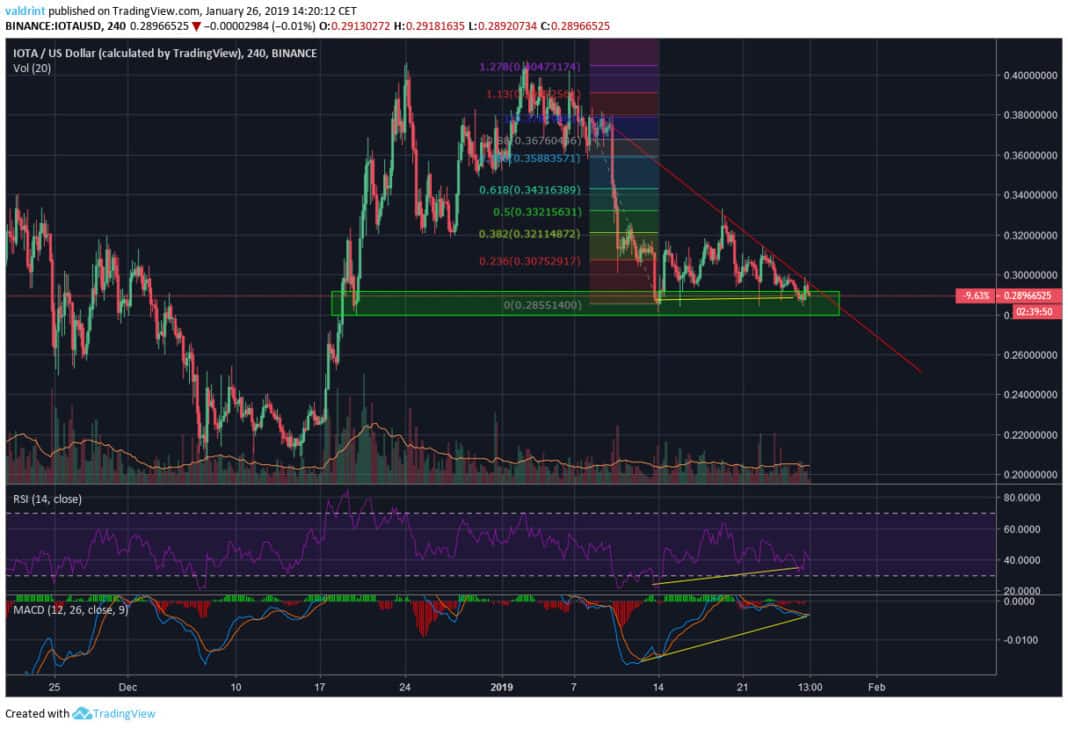
A look at the 4-hour chart for IOTA shows that price is at the small support area of $0.27-$0.29.
There is significant bullish divergence developing in the RSI and the MACD.
Price Prediction: I believe that during the next week price will break out of the red resistance line and head for the fib resistances of $0.33 and 0.358 respectively.
Biggest Risers Prediction:
After analyzing the price charts thoroughly I believe that the two biggest risers this week will be TRX and IOTA.

